The overall number of simultaneous calls on all astrad servers
2011-03-15 E.
The first chart shows two curves. The time spent on dialing over the time spent on speaking is shown in red. The speaking time over the dialing time is shown in green. In the second chart, we see the absolute values in terms of simultaneous channels. The post-dial pending sessions are represented via the red area and the answered conversations via the green area.
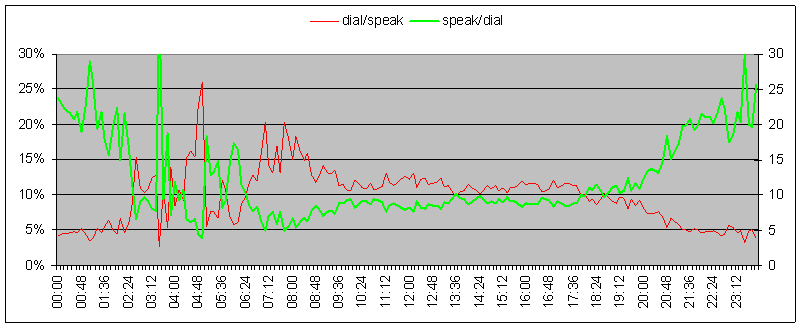
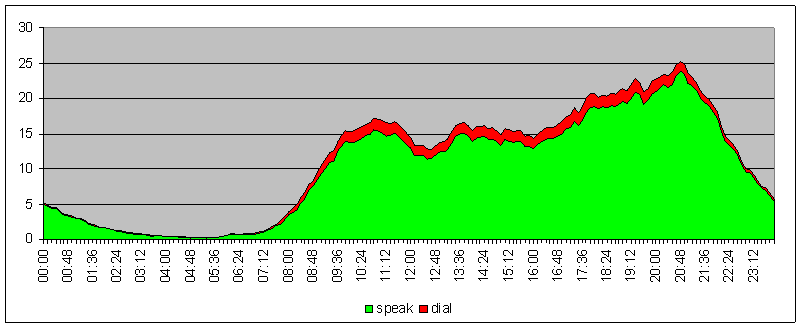
The number of simultaneous calls of the second chart represents the total value over all five astrad servers. Concerning the fact that we cannot spot easily the problem of 9h-10h by a significant anomaly on the graph, maybe, similarly to the peak of 21h, we must expect more speak-time and less dial-time at the morning peak as well?
The data is generated via the following command line:
$ cat ?/Master.csv-* | cut -d, -f5-7 | perl -e '$d=480; sub breakdown{my ($A,$B,$slot)=@_; for(my $i=int($A/$d)*$d;$i<$B;$i+=$d){my $k=$d; $k-=$A-$i if($A>$i); $k-=$i+$d-$B if($B<$i+$d); $load{$slot*24*3600+$i%(24*3600)}+=$k}} while(<>){if(/^"([0-9-]+) ([0-9]{2}):([0-9]{2}):([0-9]{2})","([0-9]+)","([0-9-]+) ([0-9]{2}):([0-9]{2}):([0-9]{2})"$/){$stop=2*24*3600+$2*3600+$3*60+$4;$dur=$5;$start=$stop-$dur;$setup=($6 lt $1?1:2)*24*3600+$7*3600+$8*60+$9; &breakdown($start,$stop,0); &breakdown($setup,$start,1)}} for my $i (keys %load){if($i<24*3600){$speak{$i}=$load{$i}}else{$dial{$i%(24*3600)}=$load{$i}} $session{$i%(24*3600)}+=$load{$i}} for my $i (keys %session){print "$i,$dial{$i},$speak{$i},$session{$i}\n"}' | sort -n > out10.csv
200 CDR files are considered from Master.csv-20110202.gz through Master.csv-20110314.gz on 5 servers.