Anyway, we definitively need more data in order to see the drop down to the 1% losses (as observed in previous charts). So we wait your new data, to be collected within 15 to 16 hours. Hopefully we will have a clear picture then.
I have the Excel file ready, I need only your input.
Regards,
Emin
On 2011-06-21 18:02, Emin Gabrielyan wrote:
As you see the experience did not last enough time after the delay reached its floor value of 30 seconds.
restart the experience with the following values of sleep period:
It will last about 15h
notify initial sleep value
4000 seconds then
next sleep
sleep=max(sleep/1.1,30)
attached [110621-notify sleep is old val divided by 1.1 factor.xlsx] you will find the progress of delays.
The experience (which is insufficient) you did had the following parameters
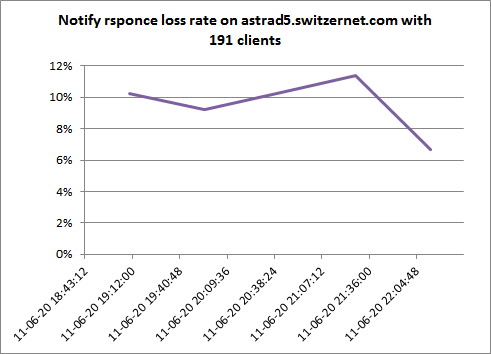
period min 2011-06-20 19:10 period max 2011-06-20 22:13 N points on the chart 4 delta 0:45:52 duration 3:03:29 customers 191 packets 3603 waves 18.86387435 periodicity 0:09:43.602 server astrad5.switzernet.com title Notify rsponce loss rate on astrad5.switzernet.com with 191 clients notify initial sleep value
3600 then
next sleep
sleep=max(sleep/1.5,30)
The chart shows a drop, but it is not convincing. We need to see a drop and proof that it lasts.
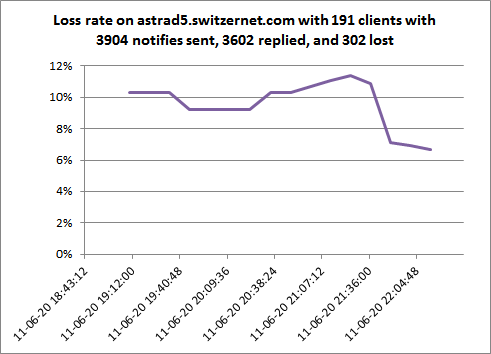
Abstract: We observed that the NAT gateways of certain customers change or expire the port mapping entry of the UA's SIP port, sometimes more frequently than the registration frequency of the UA. As a result, after a certain time the UA is not reachable for incoming calls. In this experience we send notify messages to all UA known to be registered on the SIP server and we account the rate of replies sent back by UA. If the port mapping of a user is gone, the UA will not respond. However, as we keep sending the notify messages (to the address recorded in the location table), as soon as the UA sends us a new register and provides us an updated port value, the flow of notify messages will mandatorily keep the NAT port open until the next registration. That is irrespectively of the delay it will take to come. This means that we have to observe high rate of losses of replies to notifies, which will drop gradually along the reception of registration updates coming from slow UAs. We are sending notifies to all users with an initial interval between the waves of notifies equal to 3600 seconds. The wave itself takes about 5 seconds. The interval decreases with by factor of 1.5 after each wave, until it reaches to 30 secods (and stops decreasing). The average periodicity (during a 3h period) is approximately of 9 minutes. The drop on the chart is not clear, because we do not have enough stats with short intervals. The experience must be relaunched for a much longer period (lasting long enough after the delay between waves reached the floor value of 30 seconds).
attached [110621-astrad5-notify-chart.xlsx] you will find the input data and the construction of the above shown chart
Emin
On 2011-06-21 10:30, Oussama Hammami wrote:Ci-joint le résultat du teste décrit ci-dessous.
On 2011-06-20 19:32, Oussama Hammami wrote:Salut,
J’ai lancé le teste avec une durée de SLEEP variable sur astrad5 :
TEST astrad5:
-------------
Ngrep PID    : 19379
START        : 2011-06-20 19:10
IP           : 91.121.178.108
NB. Customers: 191
+---------------------+---------------------+-----------+-----------+
| START               | STOP                | COUNT = 1 | COUNT > 1 |
+---------------------+---------------------+-----------+-----------+
| 2011-06-20 18:00:00 | 2011-06-20 18:30:00 |       178 |        13 |
| 2011-06-20 18:30:00 | 2011-06-20 19:00:00 |       180 |        11 |
+---------------------+---------------------+-----------+-----------+
On a commencé avec une durée de 3600s, une fois arrivé a une durée de 30s le script tournera 10 fois avec cette valeur et il s’arrête.
TIME                - COUNT - INTERVAL
2011-06-20 20:10:00 - 10    - 3600 -> START
2011-06-20 20:50:00 - 10    - 2400
2011-06-20 21:16:40 - 10    - 1600
2011-06-20 21:34:27 - 10    - 1067
2011-06-20 21:46:19 - 10    - 712
2011-06-20 21:54:14 - 10    - 475
2011-06-20 21:59:31 - 10    - 317
2011-06-20 22:03:03 - 10    - 212
2011-06-20 22:05:25 - 10    - 142
2011-06-20 22:07:00 - 10    - 95
2011-06-20 22:08:04 - 10    - 64
2011-06-20 22:08:47 - 10    - 43
2011-06-20 22:09:17 - 09    - 30
2011-06-20 22:09:47 - 08    - 30
2011-06-20 22:10:17 - 07    - 30
2011-06-20 22:10:47 - 06    - 30
2011-06-20 22:11:17 - 05    - 30
2011-06-20 22:11:47 - 04    - 30
2011-06-20 22:12:17 - 03    - 30
2011-06-20 22:12:47 - 02    - 30
2011-06-20 22:13:17 - 01    - 30 -> EXIT
On 2011-06-20 18:17, Emin Gabrielyan wrote:Now it looks logic
Here is a conclusion of this experience:
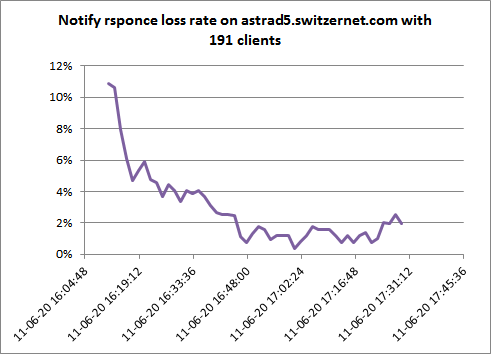
Here is the chart:on astrad5.switzernet.com the NAT routers of certain customers change or expire the port mapping of the SIP port more frequently than the registration frequency of the UA. As a result after a certain time the UA is not reachable. In this experience we send notify messages to all UA registered on the SIP server and we register the rate of replies sent back by UA. If the port mapping of a user is gone, the UA will not respond. However, as we keep sending the notify messages, as soon as the UA sends us a new register and updates its port value, the flow of notify messages will keep the port open until the next registration irrespectively of the delay it will take to come. This means that we have to observe high rate of losses, which will drop gradually as a result of reception of the updated registrations of slow UAs. We are sending notifies to all users with intervals between the waves of notifies equal to 30 seconds. The wave itself takes about 5 seconds. Thus, the periodicity is of approximately 35 seconds.
The Excel file is attached
On 2011-06-20 17:40, Oussama Hammami wrote:Yes = GREEN
On 2011-06-20 12:41, Task-By Emin Gabrielyan wrote:
Do you work on this?
Emin Gabrielyan
Le Jun 17, 2011 à 17:24, Emin Gabrielyan <emin.gabrielyan@switzernet.com <mailto:emin.gabrielyan@switzernet.com>> a écrit :
Below is a chart showing, contrary to all expectations, the increase of reply losses to notify methods.
We were expecting to have 0% losses after a while.
This increase is probably due to an error in the script that collected the data.
The script must be done again. BTW it must not consume 90% of CPU (and the reason is probably in the same error).
<moz-screenshot-48.png>
Attached you will find the Excel file computing this chart.
Emin
On 2011-06-17 16:21, Task-by Oussama Hammami wrote:
Ci-joint les fichiers Excel représentant les résultats des testes d’envoi de Notify.<110616-astrad6-notify-ngrep.xlsx>
*/Astrad6 :/*
Sur ce serveur on a lancé le script d’envoi de notify ainsi que ngrep à 2011-06-16 16:02
On a arrêté le script ngrep à 2011-06-16 18:36
_Notify ngrep:_ 110616-astrad6-notify-ngrep.xls
_Location history: _110616+1-astrad6-location-history.xls
/*Astrad7:*/
On a uniquement lancé le script d’envoi de notify à 2011-06-16 16:11
_Location history:_ 110616+1-astrad7-location-history.xls