Testing a graph of redundant packets on
a sample sequence of arriving packets
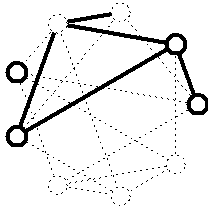
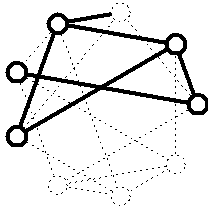
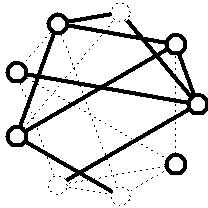
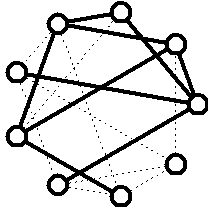
We are tracking the number of packets to be received needed for recovery of all original data packets. Below diagram shows the tracking on a random arrival sequence of non-repeating packets (assuming that the first 9 packets are already collected). In order to test the graph we need to pass through tens of thousands of random arrival sequences. Original packets are the nodes of the graph (the circles) and the redundant packets are the edges of the graph. Graph, which is being tested, contains 9 original packets and 18 redundant packets (count also the dashed links). The received packets (edges or nodes) are marked in thick.
|
9 available packets (5 redundant and 4 original) |
|
2 original packets are restored, but 3 packets are
missing |
|
|
||
|
|
||
|
|
|
|
|
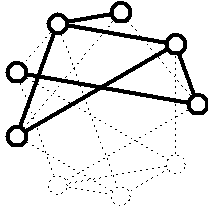
10 available packets |
|
All original packets cannot be restored |
|
|
||
|
|
||
|
|
|
|
|
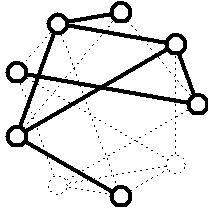
11 available packets |
|
All original packets cannot be restored |
|
|
||
|
|
||
|
|
|
|
|
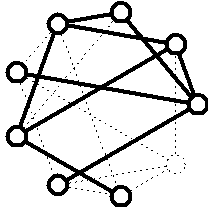
12 available packets |
|
All original packets cannot be restored |
|
|
||
|
|
||
|
|
|
|
|
13 available packets |
|
All original packets cannot be restored |
|
|
||
|
|
||
|
|
|
|
|
14 available packets |
|
All original packets still cannot be restored |
|
|
||
|
|
||
|
|
|
|


|
15 available packets |
|
All original packets are finally restored |
|
|
||
|
|
* * *