ACD Quality routing call rejection algorithm
Emin Gabrielyan
This document questions the load balance obtained by the quality routing algorithm when the vendors have their own reject rates (no circuit channel available) that are significant. It seems that our algorithm penalizes the vendor with high reject rate.
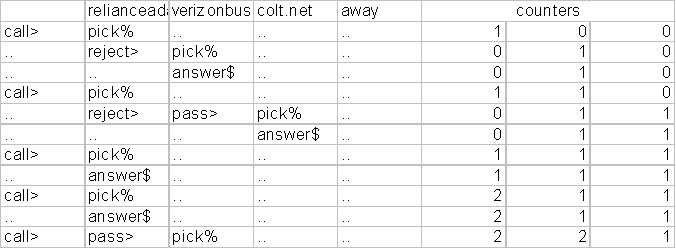
A simulation is carried out in an Excel file. The following example shows a sequence of calls. The progress of each call takes several steps on the vertical timescale. Arrival of calls are indicated in the first column by keyword “call>”. The calls picked by the quality router are indicated by the keyword “pick%” under the corresponding vendor. Picking the call by the quality router does not guarantee that it is answered. If the call is answered the indicator is the keyword “answer$”. If the call is rejected, the indicator is “reject>” meaning that the call will be passed to the next route in the list.
[xls]
The simulator is limited by a scenario involving 3 vendors and an identical target load of 1/3 per vendor.
The simulator did not show that the preference order of vendors in the list has an impact on obtained loads. A careful verification is however needed (especially for unequal vendor reject ratios).
The simulator showed that when all reject ratios of vendors are identical then the target loads are obtained. However a high reject ratio (equal for all vendors) increases the fraction of calls leaving the quality router after the third attempt.
 We have to check the possibility of the second
round over the same connections of the router.
We have to check the possibility of the second
round over the same connections of the router.
We also see that when one of vendors has a lower acceptance ratio, the algorithm does not deliver the target loads. The following chart shows that as the acceptance ratio of a vendor (the first histogram) decreases the obtained balance (last two histograms) are differing significantly from target loads (the second histogram). The discrepancy between the target and factual loads is stronger when the answer rate of Verizon is minimal. The high rejection rate of Verizon penalizes it whereas our targets are computed based on ACD only.
Note that the cumulative height of the fourth histogram is smaller than of the third one. It is because the fourth histogram shows the distribution of all calls including those which definitively left the router (to next available routes if any). The difference between the third and forth histograms represents the fraction of the lost calls.
It has been suggested to decrement upon a vendor reject the counter of calls associated to a vendor. Effectively, as shown on the chart below, it results in obtaining the loads aimed by target values. However it increases significantly the fraction of the lost calls. The issue can be addressed by permitting additional round(s) over the same three connections of the router.

Design the analytical formulas representing the
model
Examine the impact of the preference order
Extend the simulator to the case with variable
targets (do not compute the current percentages, but rather the expected
counters for the current total of attempts according to the expected loads)
References
Target loads versus obtained loads with ACD Quality routing call rejection algorithm
http://switzernet.com/3/public/101208-acd-routing-rejects/
http://switzernet.com/3/public/101208-acd-routing-rejects/
An example of running quality routing system with three vendors:
http://switzernet.com/3/public/101026-acd-routing-mon/
http://www.unappel.ch/public/101026-acd-routing-mon/
ACD routing for fighting malicious routes with wrong signal supervision:
http://switzernet.com/public/091020-acd-routing/
http://unappel.ch/public/091020-acd-routing/
http://intarnet.com/2/public/091020-acd-routing/
http://parinternet.ch/2/public/091020-acd-routing/
Documentation of the current version as well as the details of the project:
http://switzernet.com/public/100331-acd-quality-routing/
http://unappel.ch/3/htdocs/public/100331-acd-quality-routing/
* * *
![]()
Copyright © 2009 – 2010, Switzernet